Win More Clients: 5 Proposal Tools by Investwell Mint
Imagine this: you’re halfway through a pitch to a high‑value prospect when they pause and ask, “How do I know this allocation really works for me?” Your spreadsheet files are buried in tabs, the numbers on your slides don’t align, and suddenly your confident delivery stalls.
Investwell Mint solves that exact pain point. Its suite of data‑driven proposal tools for mutual fund distributors—Model Portfolio Comparison, Growth Calculator, Rolling Return Analysis, Trailing Return Analysis and Portfolio Overlap—puts live analytics at your fingertips. With instant portfolio gaps, return forecasts and diversification insights, you’ll keep the conversation flowing and the sale moving forward.
These are the five tools which will help you pitch your services in the most effective way:
Spot Portfolio Gaps via Model Portfolio Comparison
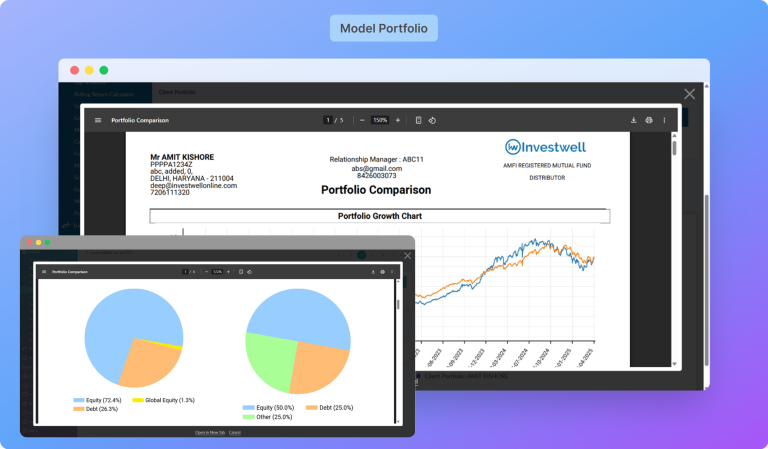
Path: Broker Dashboard > Utilities > Model PortfolioMost prospects come in with portfolios built over time—ad hoc, scattered and rarely aligned to a strategy. What they need is perspective.
With Investwell Mint’s Model Portfolio Comparison, you can easily create an ideal model portfolio that reflects your investment approach and compare it side-by-side with your prospect’s current portfolio. Here’s how the tool helps:
- Build a tailored model portfolio: Create a model that aligns with your investment strategy, asset allocation, and performance expectations.
- Side-by-side comparison: Directly compare the model portfolio with your prospect’s actual holdings to identify differences.
- In-depth analytics: Get a visual analysis of portfolio growth, asset allocation, and returns.
- Build a tailored model portfolio: Create a model that aligns with your investment strategy, asset allocation, and performance expectations.
Forecast Returns through Growth Calculator
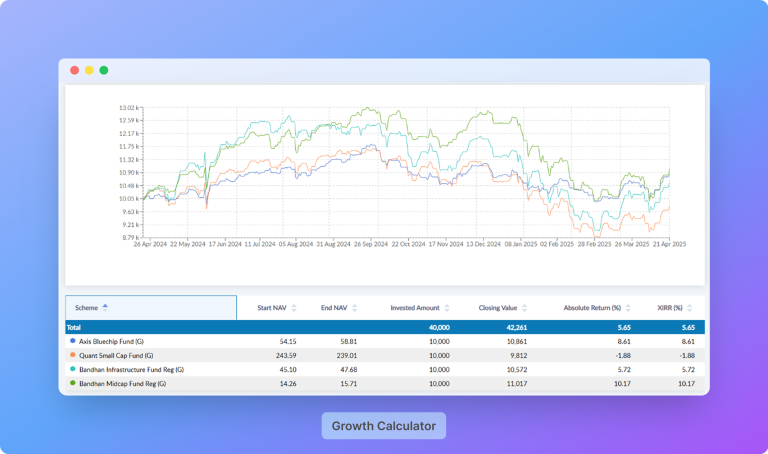
Path: Broker Dashboard > Utilities > Scheme Compare > Growth Calculator
When prospects ask how their investments will perform over time, they want clear answers from their Mutual fund distributor or financial advisor, not just vague predictions.
The Growth Calculator does just that. It provides them with precise, data-backed projections, offering a clear picture of future growth that they can trust. Here’s how it works:
- Input the details: Choose a scheme(s), enter the investment amount, and define the time frame.
- Generate return forecasts: View the closing value, absolute return, and XIRR to project how the investment will grow over the specified period.
- Visualize the growth: The graph provides a clear visual representation of how the investment grows over time, allowing you to highlight key milestones and trends.
- Compare across schemes: Compare the growth of different schemes, highlighting which one offers the best returns for your prospect.
Gauge Consistency with Rolling Return Analysis
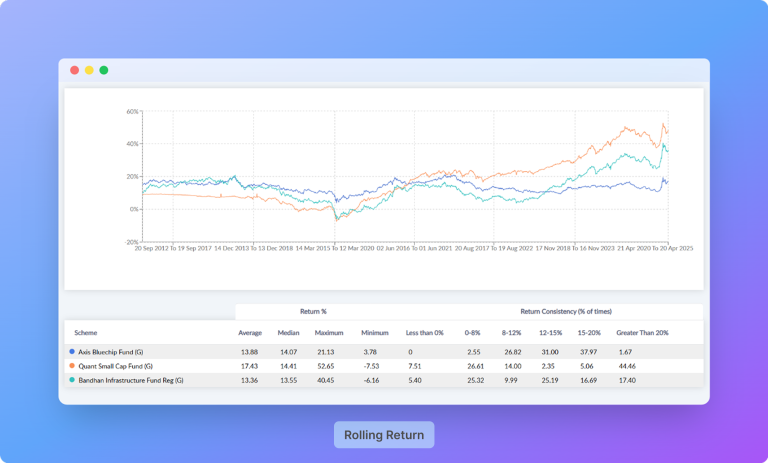
Path: Broker Dashboard > Utilities > Scheme Compare > Rolling Returns
When assessing a mutual fund, investors often focus on a single return figure—whether it’s last year’s return or the return since inception. However, as you may know, relying on a single snapshot can be misleading, because it doesn’t account for how a scheme performs in different market conditions over time.
This is where Rolling Return becomes essential:
- Choose your schemes and time period: Select the schemes you’re comparing and set the rolling return window (1, 3, 5, or 10 years) to evaluate performance.
- View overlapping periods: See how each scheme performed over overlapping periods to assess consistency across market cycles.
- Detailed analysis: The output includes a graph showing return trends over time, as well as a summary table with important data like:
- Average, median, and max/min returns
- Number of negative periods
- Consistency across different return bands
Track Historical Performance using Trailing Return Analysis
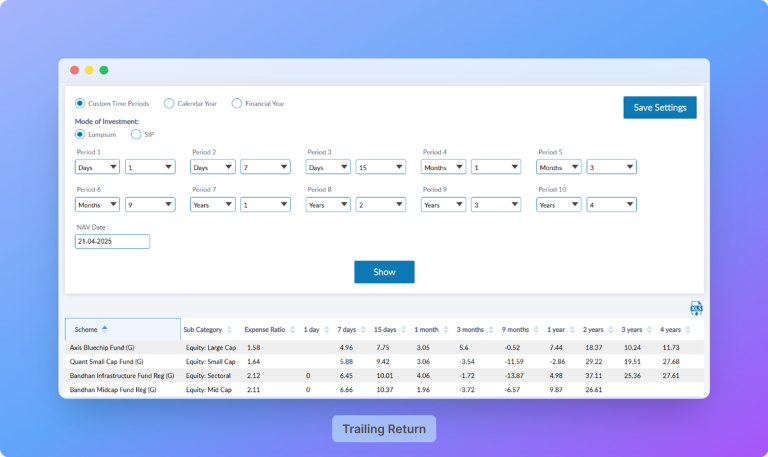
Path: Broker Dashboard > Utilities > Scheme Compare > Trailing Returns
While Rolling Return shows the consistency of a scheme over time, Trailing Return focuses on evaluating how a scheme has performed historically over different time frames.
With Investwell Mint’s Trailing Returns, you can analyze mutual fund schemes based on different timeframes. This feature in our mutual fund software enables a better understanding of a scheme’s long-term stability. Here’s how it works:
- Lumpsum and SIP modes: Evaluate the scheme’s performance in both Lumpsum and SIP modes, offering flexibility to compare performance across different investment styles.
- Custom Time Periods: Choose from up to 10 user-defined durations to examine returns over your preferred timeframes.
- Detailed Summary Table: View key metrics like average, median, and max/min returns, number of negative periods, and consistency across return bands.
Return Trends Graph: The tool also provides a graph showing return trends over time, offering visual insights into how the scheme has performed across different market cycles.
Detect Concentration Risks using Portfolio Overlap
Path: Broker Dashboard > Utilities > Scheme Compare > Portfolio Overlap
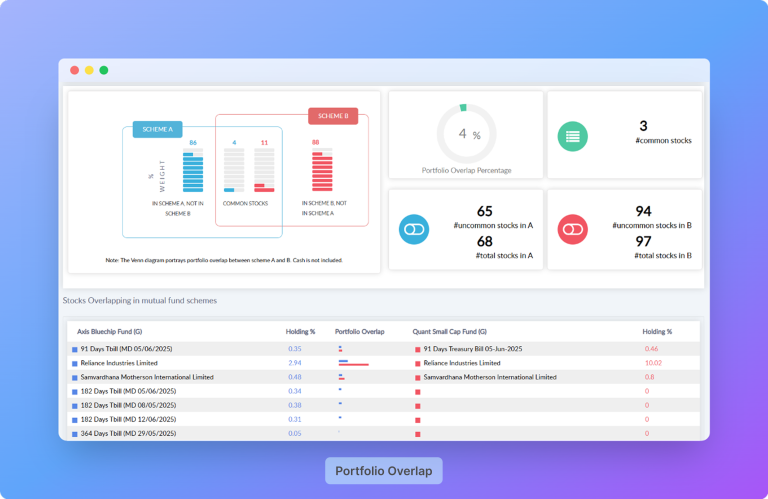
Sometimes, investors hold multiple mutual funds thinking they’re diversified—only to discover that many of those funds invest in the same set of stocks. That’s where the Portfolio Overlap tool comes in.
It helps you analyse whether your prospect’s investments are truly diversified—or just different wrappers around the same core holdings. Here’s how it works:
- Select multiple schemes: Choose the mutual fund schemes you want to compare for overlap analysis.
- Overlap % Matrix: A colour-coded grid showing the overlap level between selected schemes. Green signals low overlap (0–20%), and red indicates high overlap (80–100%).
- Click to Drill Down: Select any scheme pair to view:
- Number of common vs. unique stocks
- Names of overlapping stocks
- Holding % of each common stock in both schemes
- Number of common vs. unique stocks
Close Confidently with Investwell Mint!
In advisory conversations, clarity is currency. Each of these tools in Investwell Mint is built to help you move away from broad claims and towards evidence-backed recommendations. Whether you’re highlighting gaps, projecting returns, or assessing scheme consistency and overlap, you’re not just answering questions—you’re guiding decisions.
Head to Investwell Mint, try the tools out with your next prospect, and present recommendations that speak for themselves.
If you face any issues, feel free to reach out to us!


